New CGIAR Results Dashboard
There is still an enormous challenge at hand to reach the Sustainable Development Goals (SDGs) in the next 10 years. Being able to understand how different institutions contribute to this challenge is important information to all who are working towards the SDG agenda. CGIAR recently launched a new Dashboard that makes its impact more visible to a large audience. A very interesting and useful tool for Food and Nutrition Security professionals.
The Netherlands-CGIAR Strategic Partnership
CGIAR is “a global research partnership aiming to reduce poverty, improve food and nutrition security, and improve natural resources and ecosystem services”. The Government of the Netherlands signed a Memorandum of Understanding (MoU) with CGIAR in 2015. This MoU marks the starting point of a long-term strategic partnership that aims to work together and strengthen each other in agri-food system research and development within the framework of the SDG agenda. With 12 CGIAR Research Programs, 4 Platforms and 15 Centers, CGIAR is a complex system. This complexity makes communication about the impact and contribution of CGIAR’s activities even more important and challenging at the same time.
The Results Dashboard
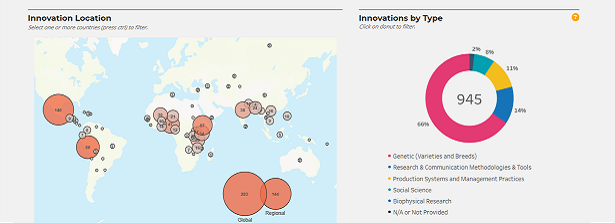
Recently, CGIAR has taken an important step towards improving the communication channels around its impact by launching the CGIAR Results Dashboard. The data currently available on the Dashboard is for 2017 and 2018 and covers the whole CGIAR. This means that a lot of data is accessible through the Dashboard, including publications, innovations in management practices, knowledge and technologies and number of people trained. “Just for 2018 this relates to 20 contributions to SDGs and CGIAR System Level Outcomes, +100 policies, +900 innovations (including 400 new crop varieties), 1900 peer reviewed publications (59% in open access, 82% ISI), +1000 external partners, 1 million people trained, including 545 PhD students” states Phillipe Ellul, Program officer at CGIAR.
As the provided figures and maps are interactive, they are gateways to additional information at other levels, like sub-country level or CGIAR Research Program level. Users of the Dashboard can zoom into the level depending on their personal preferences and interests. Because of CGIAR’s strong commitment to open access and open data, also the raw data is available through the Results Dashboard.
Those who are familiar with the CGIAR Annual Performance Reports might recognize the look and feel of the Dashboard, as it uses a similar structure. For others, it might take a while to completely figure out how to use the many options of the Dashboard, but the time investment is well worth it.
More information
For further details about the NL-CGIAR Strategic Partnership, visit the Partner page on the F&BKP website. Here you can find background information, news and interesting research articles concerning the NL-CGIAR Strategic Partnership and the CGIAR System Organization.